
Case Study: A Machine Learning Solution to Bitcoin Valuation
Exploring the Metrics that Measure Intrinsic Value

This case study is intended as data analysis and not investment advice.
In 2008 Satoshi Nakamoto released his Bitcoin white paper detailing a new peer to peer electronic payment system that would eliminate the need for trusted intermediaries in electronic payments. Bitcoin allowed value to be transferred around the world in minutes without permission from banks or governments.
A barrier to adoption for this new digital cash is price volatility. Efficient price discovery for any asset relies on sound valuation models. Stocks have EBITDA and bonds have par value. Bitcoin needs a Fair Value Model based on data.
In this case study I explore a method for Bitcoin valuation that measures intrinsic value with machine learning. The aim is to discover Bitcoin metrics hidden in years of daily data that can facilitate a value investing benchmark.
To discover this benchmark we must determine what gives Bitcoin it’s value. Let’s feature four measurements that correlate impressively with Bitcoin price. Also, they tell a story of how digital assets create value.
Metcalfe’s Law
A network’s value is proportionate to the square of the number of connected users. The concept was first used by Gilder to explain how telecommunications networks gain value as more devices become connected. Metcalfe in his pioneering work on the internet adopted the concept but with users. If we apply a Pearson’s correlation comparing Active Addresses squared to the daily trading price of Bitcoin over the last 12 years a strong correlation is discovered. As Bitcoin users increase the price increases exponentially.
Pearson’s Correlation = .737, p value =2.2e-16

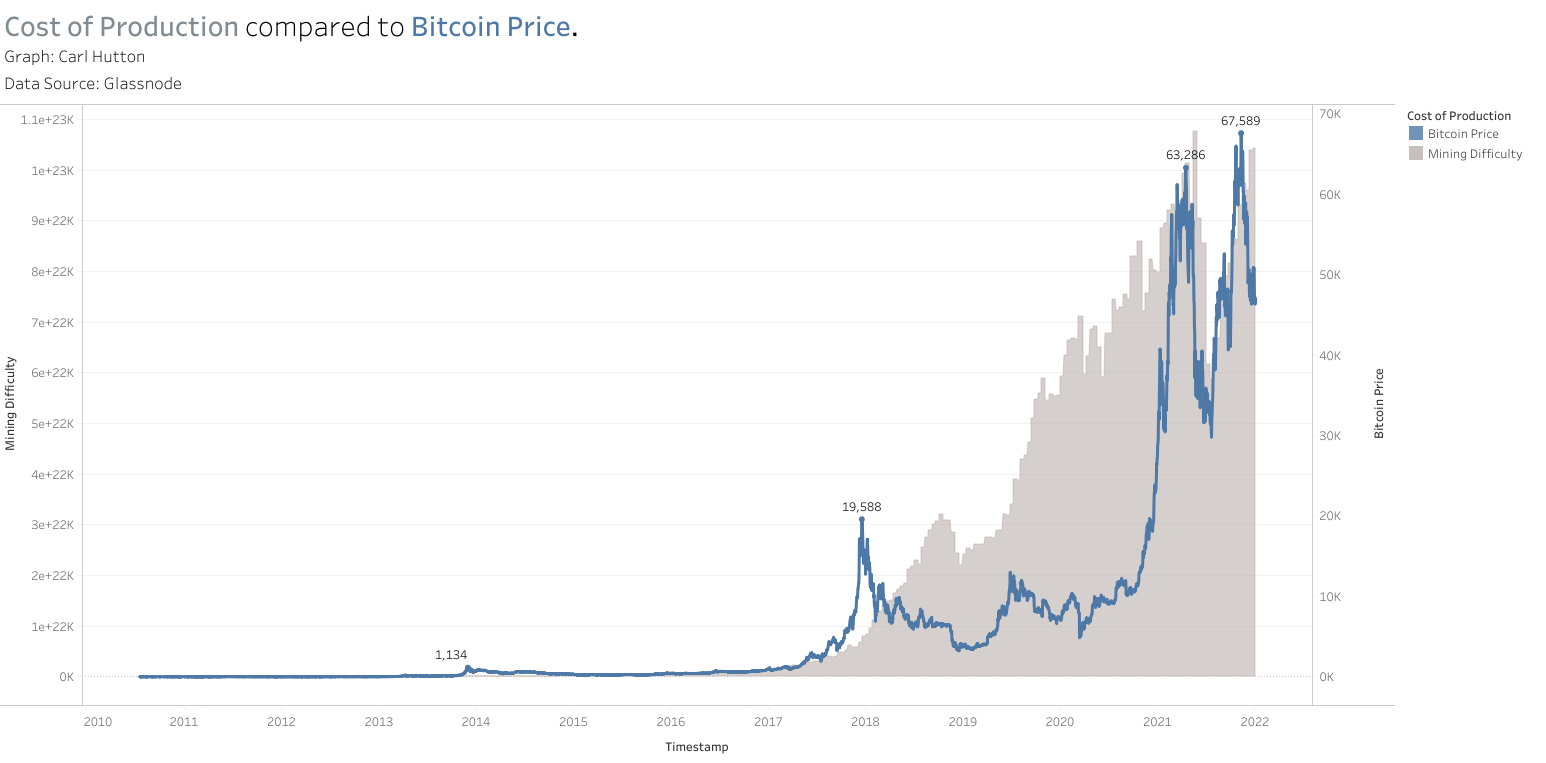
2. Cost of Production
Cost of Production as a valuation theory goes all the way back to Adam Smith in the 18th century. Goods or commodities are valued at the aggregate of their production costs. If a barrel of oil costs $100 to extract, then it’s fair value must be more then $100. If the demand curve will not support this price producers leave the market until a shortage occurs. Price then rebounds to the sum of production costs.
Cost of production in Bitcoin is determined by the deflationary algorithm written into the code. Bitcoin are mined by providing computing power to secure the network. The level is set to about 37.5 per hour. If mining occurs faster or slower the algorithm adjusts difficulty until equilibrium is met. As such we have on chain data that provides a perfectly symmetrical measure for cost of production. As Bitcoin becomes more difficult to mine more expensive machines using more electricity are required.
Applying a Pearson’s correlation between mining difficulty and price over the last 12 years of daily data results in a strong correlation. As mining difficulty goes up price increases.
Pearson’s Correlation = .829, p value =2.2e-16
Stock to Flow
In 1954 Clower was the first to offer a detailed analysis of stock to flow as a valuation theory. The premise is price adjusts as available quantities of a good or commodity change in proportion to annual production. It’s an elegant way to measure scarcity. The pseudonymous Bitcoin analyst Plan B pointed out this measure of scarcity predicts a huge increase in Bitcoin value overtime. Bitcoin’s algorithm halves the mined Bitcoin roughly every four years. The Bitcoin market exists in a constant state of declining production.
Applying a Pearson’s correlation between stock to flow and price over the last 12 years of daily data results in a strong correlation. As the ratio of Bitcoins in circulation to annual coin mining goes up price increases.
Pearson’s Correlation = .931, p value =2.2e-1

United States Dollar
Any attempt to value assets denominated in dollars must account for the inflationary nature of the U.S. Dollar. The Federal Reserve has a mandate to maintain maximum employment with inflation near 2%. The extent to which they are incapable of meeting this mandate or deliberately sabotaging the mandate under pressure from special interests is unknown.
We do know that the number of U.S. Dollars in circulation has increased 2.5 times over the last 12 years. A fact that undoubtedly effects the value of all assets denominated in dollars.
Applying a Pearson’s correlation between money supply (M2) and price over the last 12 years of daily data results in a strong correlation. As the ratio of dollars in circulation increases the price of Bitcoin increases.
Pearson’s Correlation = .826, p value =2.2e-16


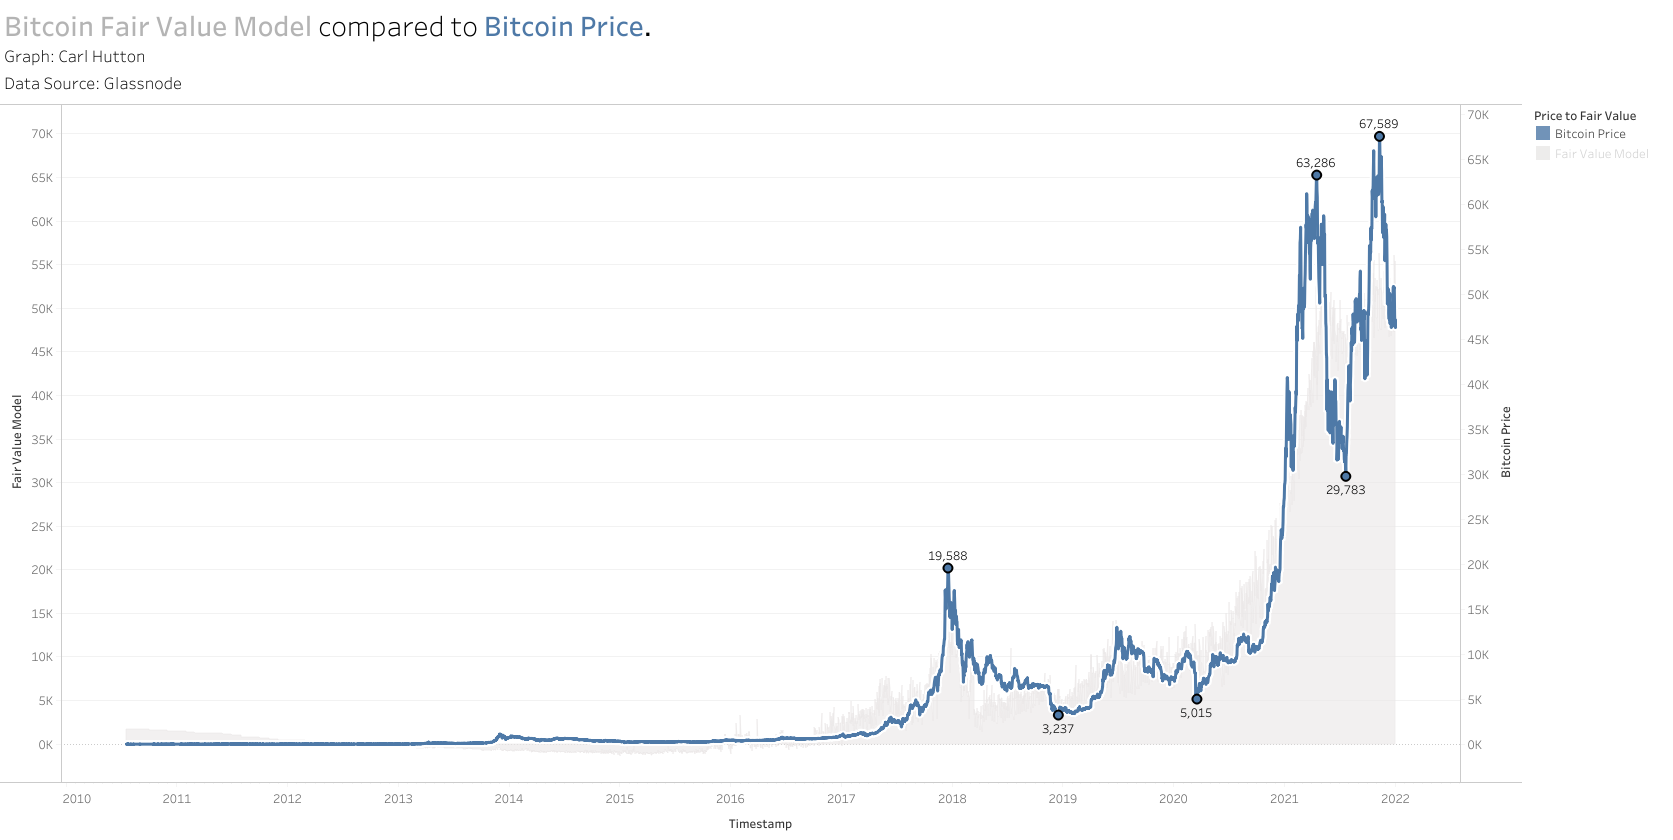
5. Bitcoin Fair Value Model
Multivariate linear regression is a powerful tool for understanding complex relationships between multiple variables. I have written in R code a multivariate regression model that tracks twelve years of daily activity. The Bitcoin Fair Value Model uses publicly available data sets to proxy for the valuation theories discussed. It then calculates value based solely on the input variables. It is free from the human emotions that cause speculative markets to fluctuate. The Fair Value Model does not output a price prediction. Rather, its output is a calculation of the fair price for Bitcoin given the data inputs.
Pearson’s correlations for the discussed variables were impressive at .737, .829, .826. and .931. Statistical analysis revealed the model outperforms the sum of its parts. The Pearson’s correlation for the Bitcoin Fair Value Model to price is .963 with a p value of 2.2e-16.
Examining the graph of the output reveals the model did an exceptional job of calling Bitcoin overvalued during three historic tops and undervalued during three historic bottoms.
I am releasing Bitcoin Fair Value Model valuations from Jul 2010 to Dec 2022 for free in this case study. In March I will be releasing the model with up to date valuations and analysis of the variables for subscribers.
The Economist.(2022, April 23).Why the Federal Reserve has made a historic mistake on inflation
Plassard, Romain (2015 December). Lloyd, C.L (1960). The origins, development, and fate of Clower’s ‘stock-flow’ general-equilibrium program
O’Donnell, R. (1990). Smith as ‘Cost of Production’ Theorist. In: Adam Smith’s Theory of Value and Distribution. Studies in Political Economy. Palgrave Macmillan, London. https://doi.org/10.1007/978-1-349-10908-1_10
Rebecca,(2022, December1).What Is “Metcalfe’s Law”, and Why Does it Matter?(history-computer.com)
Franck, Thomas. (2022, March 31). Cryptocurrency news: 21% of adults have traded or used crypto, NBC poll shows (cnbc.com)
Pieters, Gina. (2016/01/01). Bitcoin Reveals Exchange Rate Manipulation and Detects Capital Controls, (researchgate.net)
Glassnode. (07/2017 to present). Data source for on chain analysis. (glassnode.com)